See Your Enterprise
Data More Clearly. Act With Confidence.
Bring clarity to complex enterprise data. Our data visualization services help decision-makers track performance, spot trends, and focus on what matters most.
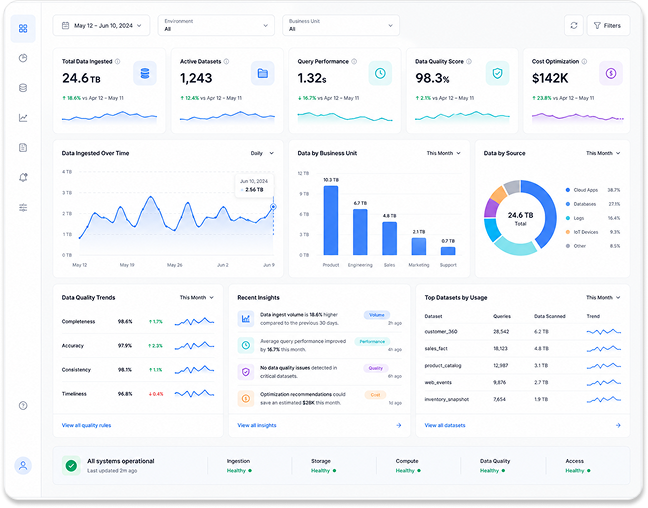
Enterprise Data Visualization Services
Built for Better Decisions
Our enterprise data visualization services cover consulting, dashboard development, interactive and
embedded experiences, designed around the decision being made rather than the data available.
Data Visualization Consulting
Define who decides what, and the views each audience needs to decide it.
Executive Dashboard Development
Board and leadership views built on agreed definitions and reliable sources.
Interactive Data Visualization
Exploration and drill-down for users who need to ask the next question themselves.
Real-Time Data Visualization
Live operational views where waiting for tomorrow’s report is too late.
Embedded Data Visualization
Insight delivered inside the applications and portals where work happens.
Custom Visualization & Reporting
Bespoke views for analysis that standard chart types handle poorly.
Build Decision-Ready Experiences With
Enterprise Data Visualization Solutions
Our enterprise data visualization solutions are built per audience, because an executive and a plant
manager need the same data presented very differently.
Executive Performance Visualization
Enterprise performance summarised without losing the ability to investigate.
Operational KPI Visualization
Frontline metrics presented for action within the working day.
Financial & Revenue Performance Views
Margin, cost, variance and revenue movement in one consistent view.
Customer & Sales Performance Views
Pipeline, retention and customer behaviour across the commercial lifecycle.
Supply Chain & Operations Visualization
Demand, inventory, supplier and logistics performance across the network.
Cross-Functional Performance Dashboards
Shared views that hold when several functions read the same number.
Business Impact of Our
Data Visualization Solutions
We agree the decisions each view supports before design, so dashboards get used rather than built.
Faster Executive Decision-Making
Reduce decision preparation time by up to 30% with clearer visual insights.
Clearer KPI Visibility
Improve KPI visibility by up to 40% with focused performance views.
Reduced Reporting Complexity
Cut reporting effort by up to 35% through streamlined dashboards.
Improved Stakeholder Alignment
Improve cross-team alignment by up to 25% with shared metrics.
Greater Data Adoption
Increase analytics adoption by up to 30% with intuitive visual experiences.
Real-Time Performance Awareness
Improve issue visibility by up to 40% with real-time monitoring.
Why Enterprises Choose KloudData
for Data Visualization Consulting
Dashboards fail on the data beneath them more often than on design. As a data visualization company with data engineering capability in-house, we build both.



Latest Data Visualization Insights
Frequently Asked Questions
What Does Data Visualization Consulting Include?
How Is Data Visualization Different From Data Analytics?
Can You Build Custom Visualizations Across Multiple Data Sources?
Which Platforms Do You Support for Enterprise Data Visualization?
How Do You Build Secure and Scalable Data Visualization Solutions?
Ready to Make Enterprise Data Easier to
Understand?
Transform complex information into visual experiences your teams can understand,
explore and use with confidence.